The scientists used the VLA to study the dynamics of Jupiter’s atmosphere from the visible cloud surfaces down to about 100 kilometres below the clouds.
“This region was previously unexplored,” said Imke de Pater, of the University of California, Berkeley. “These observations give us important new information about the temperatures, pressures, and motions of gas at these levels of the atmosphere,” she added.
The new images provide detail that was unavailable before. In order to make sensitive radio images, multi-antenna telescopes such as the VLA must gather the radio waves emitted by an object for a significant amount of time, like a time exposure in a camera. However, Jupiter rotates so swiftly, with a “day” of less than 10 hours, that a conventional radio image would be smeared in just a few minutes.
To overcome this obstacle, the researchers took advantage of the added sensitivity of the upgraded VLA, then developed an innovative data-reduction technique to “unsmear” the data from many hours of observing. The results showed a level of detail that provided new insights into the structure and dynamics of the giant planet’s atmosphere.
“We were able to make maps of Jupiter as seen at different radio wavelengths, then compare these to visible-light images made at nearly the same times,” said Bryan Butler, of the National Radio Astronomy Observatory.
Jupiter’s familiar light-coloured zones and darker belts, visible even through small telescopes, were thought to be well-correlated to radio features, but the new radio images showed some similar structures unconnected to visible-light features. The radio images showed evidence of what the scientists think are rising plumes of gas that are part of the wave pattern that produces “hot spots” in the planet’s atmosphere.
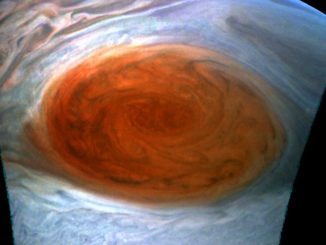
The Great Red Spot, perhaps the most famous feature on Jupiter, is also prominent, along with similar, smaller storms, in the radio images.
The new data allowed the scientists to construct graphs showing the concentrations of ammonia, an important constituent of Jupiter’s atmosphere, as it changes with altitude.
“All told, there is a wealth of information about the structure of Jupiter’s atmosphere in these new VLA images,” de Pater said. “We hope to resolve a number of outstanding questions with these and future studies using similar techniques,” she added.