Researchers from Italy, Germany, the USA, and Israel carried out the work, which was led by Fabio Falchi from the Italian Light Pollution Science and Technology Institute (ISTIL). “The new atlas provides a critical documentation of the state of the night environment as we stand on the cusp of a worldwide transition to LED technology,” explains Falchi. “Unless careful consideration is given to LED colour and lighting levels, this transition could unfortunately lead to a 2-3 fold increase in skyglow on clear nights.”
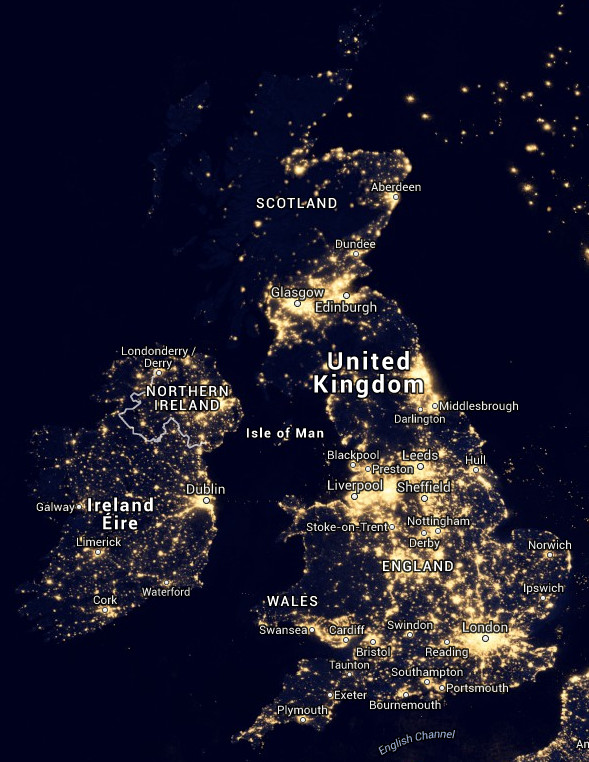
The atlas documents a world that is in many places awash with light. In Western Europe, only a few small areas remain where the night sky remains relatively unpolluted, including areas in Scotland, Sweden, Norway, and parts of Spain and Austria. In addition to a world map, the scientists provide tables showing the area of each country and what fraction of its population live under highly light polluted skies. The authors specifically examined the G20 countries, finding that in terms of area, Italy and South Korea are the most polluted, and Canada and Australia the least. Residents of India and Germany are most likely to be able to see the Milky Way from their home, while those in Saudi Arabia and South Korea are least likely.
The participation of citizen scientists in collecting the calibration data was critical, according to Dr. Christopher Kyba, a study co-author, and researcher at the GFZ German Research Centre for Geosciences. “Citizen scientists provided about 20 percent of the total data used for the calibration, and without them we would not have had calibration data from countries outside of Europe and North America,” he said.
“The community of scientists who study the night have eagerly anticipated the release of this new Atlas,” said Dr. Sibylle Schroer, who coordinates the EU funded “Loss of the Night Network” and is not one of the study’s authors.
Scott Feierabend, director of the International Dark-Sky Association, also hailed the work as a major breakthrough, saying “The new atlas acts as a benchmark, which will help to evaluate the success or failure of actions to reduce light pollution in urban and natural areas.”