In the past decades, powerful astronomical surveys have provided astronomers with data about millions of astronomical objects, allowing for large-scale statistical analysis. But big data of this kind is only as good as the tools available for analysis. Now, Melissa Ness and Marie Martig of the Max Planck Institute for Astronomy have added two powerful new tools to astronomy’s arsenal: Using sample data from the APOGEE survey (part of the Sloan Digital Sky Survey) and NASA’s Kepler Space Telescope, Ness and Martig devised two independent methods for determining the age of a red giant star from its spectrum (that is, from the properties of its light).
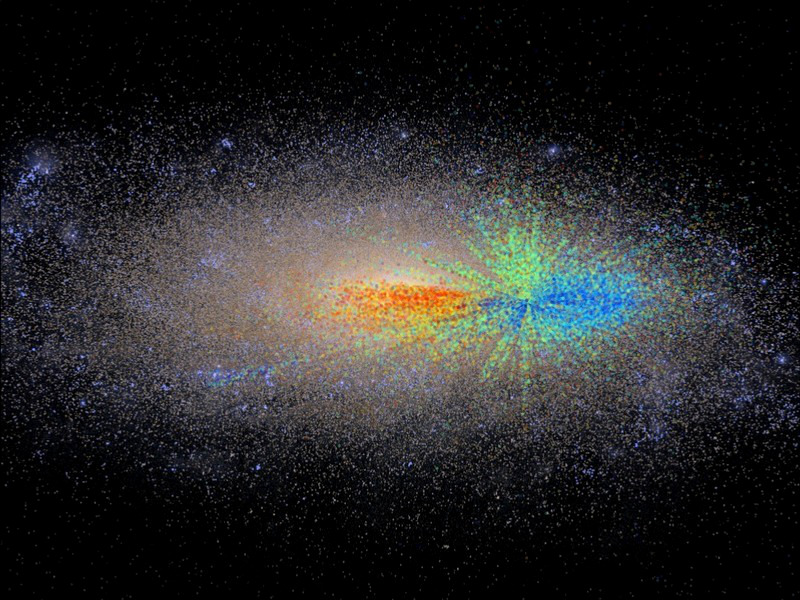
Using these methods, the astronomers were able to estimate the ages of nearly 100,000 stars that had been observed with the APOGEE survey. The result is an age map of the Milky Way, showing exactly which regions of our galaxy harbour young, old or middle-age stars (see graphic above). The map provides a representative cross section from the centre of the Milky Way to the outskirts at a distance of 65,000 light-years from the galactic centre.
With an age map of this kind, current models of how our home galaxy came into being and evolved can be put to the test. For instance, such models predict that stellar discs, the dominant stellar component of galaxies like the Milky Way, should have formed from the inside out: so, one would expect to find the older stars closer to the galactic centre, and the younger stars at the outside. The map confirms this distribution.
Also, at any given radius, the younger stars are typically found closer to the galactic plane than their older cousins. This is also confirmed by the age map of Ness and colleagues.
Techniques such as these promise much greater advantages once the data from future surveys such as APOGEE-2 or ESA’s Gaia mission are in. Eventually, it could help astronomers to reconstruct the entire star formation history of our galaxy: how many stars within our galaxy were formed at different times of galactic history, and in which regions, and how these stars have enriched our galaxy’s raw material with the various elements they produce via nuclear fusion (thus enabling the production of heavier elements, of planets and, eventually, of living beings).