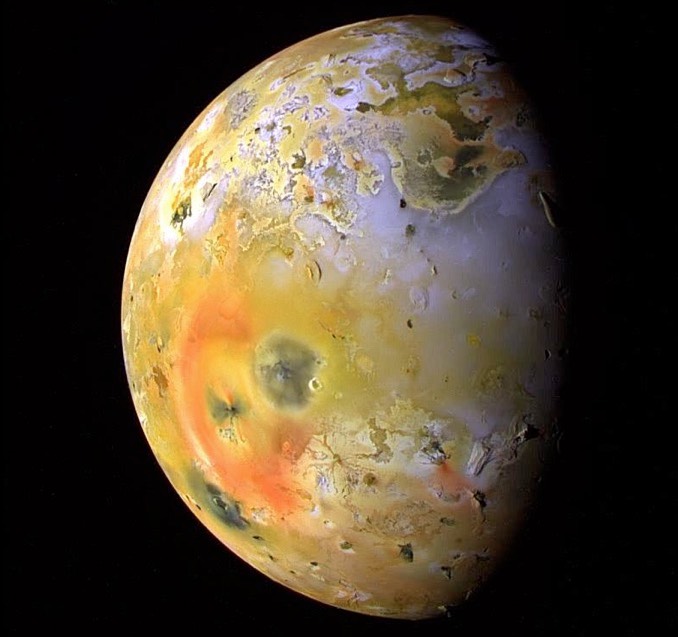
Stretched and squeezed by Jupiter’s titanic gravity as it revolves around the giant planet along a not-quite-circular orbit, the pockmarked moon Io is the most volcanically active world in the solar system.
The Voyagers, Cassini and New Horizons spacecraft all monitored Io as they flew past and the Galileo spacecraft, which spent nearly eight years orbiting Jupiter, mapped the diminutive moon, allowing researchers to count more than 150 active volcanoes.
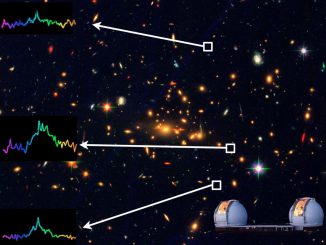
Now, thanks to the adaptive optics allowing large Earth-based telescopes to counteract atmospheric turbulence, astronomers have been able to monitor thermal emissions from Io over the past five years, between August 2013 and the end of last year, including data from previous studies. The new observations were collected by the Gemini North and W.M. Keck Observatory telescopes.
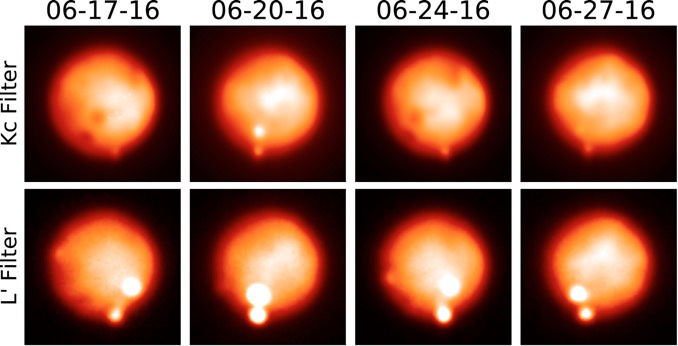
Over the course of 271 nights, the team, led by Caltech astronomer Katherine de Kleer, noted a total of 980 near infrared detections and 75 unique “hotspots.”
The brightest eruptions, lasting just a few days, “displayed temperatures above 800 K (980 Fahrenheit), confirming that eruptions at such high temperatures are common and are likely the rule rather than the exception,” the authors write in The Astronomical Journal.
Those eruptions, as noted by earlier researchers, are primarily clustered on the side of Io facing away from its direction of travel. It’s not yet known why. The current study noted 113 thermal emission detections at the extremely active Loki Patera volcano that suggests a roughly 470-day cycle that could be tied to Io’s orbital parameters.
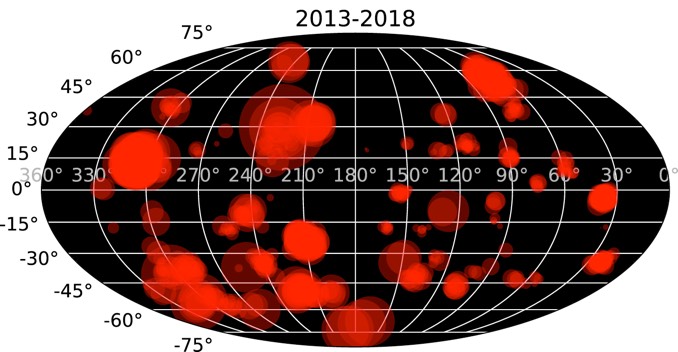
The new data set “now constitutes the largest set of unique detections of thermal emission from individual Ionian hot spots to date, permitting robust statistical analyses of properties such as the spatial distribution of hot spot activity, the variability and time-averaged power of numerous individual hot spots and the occurrence rates of bright and/or high-temperature eruptions,” the researchers write.
“These data, in combination with Galileo’s sensitivity to smaller, cooler hot spots and the multidecadal time baseline provided by ground-based occultation data, are now providing a truly global, multi-wavelength picture of Io’s volcanic activity over a wide range of timescales.