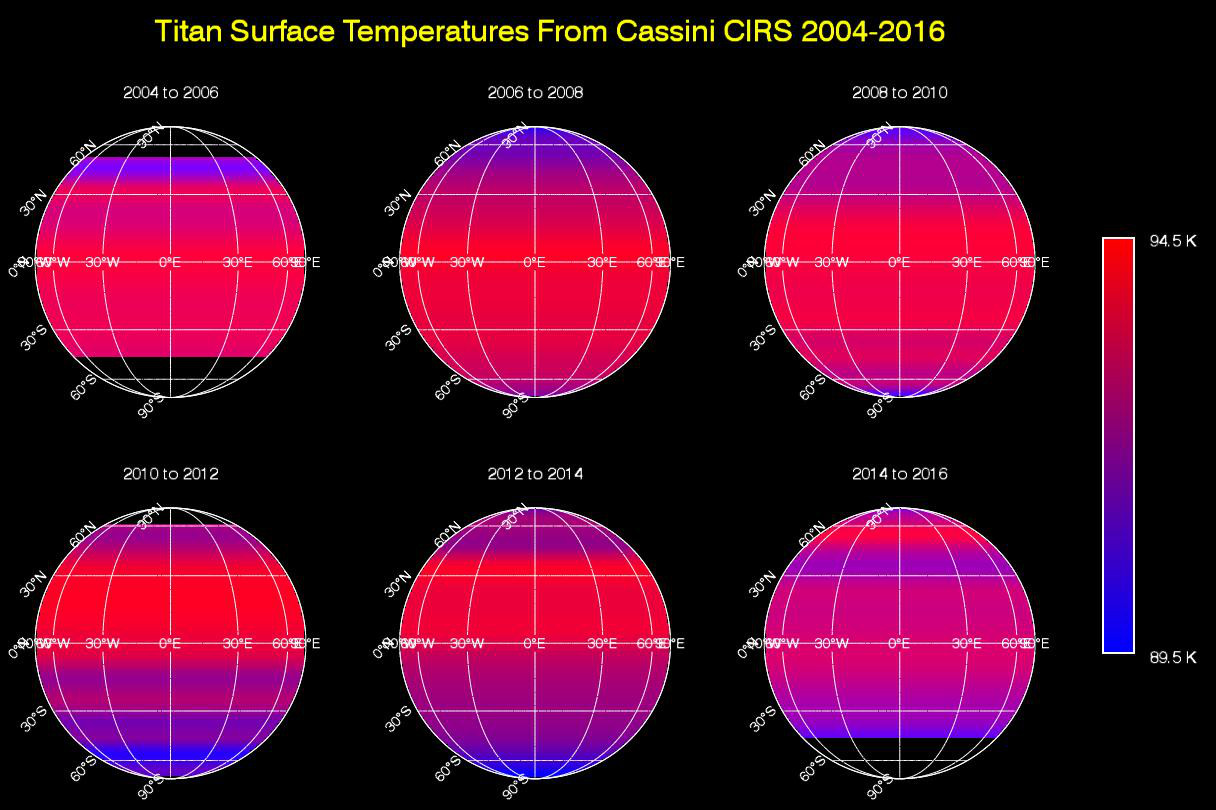
The maps show thermal infrared radiation (heat) coming from Titan’s surface at a wavelength of 19 microns, a spectral window at which the moon’s otherwise opaque atmosphere is mostly transparent. Temperatures have been averaged around the globe from east to west (longitudinally) to emphasise the seasonal variation across latitudes (from north to south). Black regions in the maps are areas for which there was no data.
Titan’s surface temperature changes slowly over the course of the Saturn system’s long seasons, which each last seven and a half years. As on Earth, the amount of sunlight received at each latitude varies as the Sun’s illumination moves northward or southward over the course of the 30-year-long Saturnian year.
When Cassini arrived at Saturn in 2004, Titan’s southern hemisphere was in late summer and was therefore the warmest region. Shortly after the 2009 equinox, in 2010, temperatures were symmetrical across the northern and southern hemispheres, mimicking the distribution observed by Voyager 1 in 1980 (one Titan year earlier). Temperatures subsequently cooled in the south and rose in the north, as southern winter approached.
While the overall trend in the temperature shift is clearly evident in these maps, there is narrow banding in several places that is an artifact of making the observations through Titan’s atmosphere. The moon’s dense, hazy envelope adds noise to the difficult measurement.
Although it moves in latitude, the maximum measured temperature on Titan remains around -292 °F (-179.6 °C, 93.6 K), with a minimum temperature at the winter pole only 6 °F (3.5 °C or Kelvin) colder. This is a much smaller contrast than exists between Earth’s warmest and coldest temperatures, which can vary by more than 200 °F, or more than 100 °C.
These Titan surface temperature maps are a visualisation of measurements that were published in Astrophysical Journal Letters.