
|
|
|
|
|
|
BY DR EMILY BALDWIN ASTRONOMY NOW Posted: 18 June, 2009
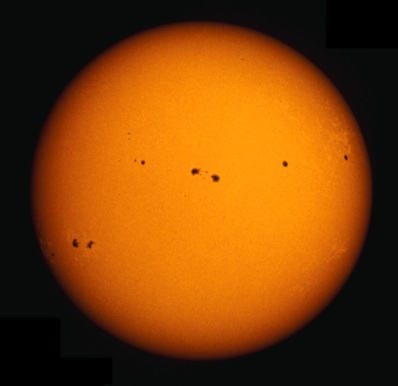
The Sun usually follows a fairly regular pattern, cycling through an 11 year period of magnetic intensity – during which, characteristic behaviour such as sunspots, flares and corona mass ejections are typical – followed by 11 years of relative quiescence. At present, the Sun is in a phase of extreme quietness when it should have been displaying more signs of activity, a mystery that has been confounding scientists over the last year.
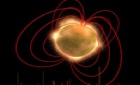
The internal structure of the Sun, indicating the location of the jet streams found between 1,000 and 7,000 kilometres below the surface. Image from AAS/SPD press conference. Thanks to long-term observations of the Sun using the NSO’s Global Oscillation Network Group (GONG) facility, scientists Rachel Howe and Frank Hill may have found the answer. GONG and its partner instrument SOHO/MDI measure sound waves on the surface of the Sun to probe structures deep inside our star, in a similar way in which geologists use seismic waves to probe the interior of the Earth. For the study of the Sun, this technique is known as helioseismology. “While the surface effects of the Sun’s torsional oscillations [jet streams] have been observed for some time, understanding of the dynamo and the origin of sunspots depend on measurements of the solar interior that are only possible with helioseismic techniques,” says Hill. Hill and Howe detected and tracked an east-to-west jet stream, known as the torsional oscillation, at depths of roughly 1,000 to 7,000 kilometres below the surface of the Sun. New jet streams are generated near the Sun’s poles every 11 years, which migrate slowly to the equator over a period of 17 years and are associated with the production of sunspots once they reach a critical latitude of 22 degrees. The stream associated with the new solar cycle is moving slower than normal, having taken three years to cover a 10 degree range in latitude compared to two years for the last solar cycle, but has now reached the critical latitude.
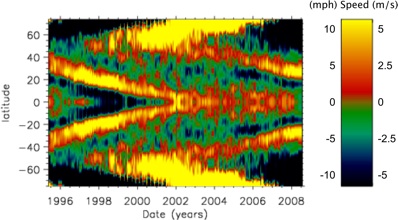
This diagram shows east-to-west motion speed of the jet streams versus latitude (yellow bands). The flow for the previous cycle (#23) can be seen in yellow at the left side of the picture, while the flow for the next cycle (#24) is visible in yellow at the right side of the image. The streams for Cycle 24 have migrated slower than those for Cycle 23. Image from AAS/SPD press conference. “It is exciting to see that just as this sluggish stream reaches the usual active latitude of 22 degrees, a year late, we finally begin to see new groups of sunspots emerging at the new active latitude,” says Hill. The current solar minimum has become so long and deep, some scientists have speculated the Sun might enter a long period with no sunspot activity at all. “This is an important piece of the solar activity puzzle,” says Dean Pesnell of NASA’s Goddard Space Flight Center. “It shows how flows inside the Sun are related to the creation of solar activity and how the timing of the solar cycle might be produced. None of the forecasting research groups predicted the current long extended delay in the new cycle. There is a lot more to learn in order to understand how the Sun creates magnetic fields.”
The observation that the jet stream has now reached critical latitude should finally herald the start of a new cycle of solar activity. Image from AAS/SPD press conference.
|
|
|
|
||||||||||||||||||||||||||||||||||||||||||